
If you’re a publisher using PubPower, you’re already taking steps toward smarter monetization. But are you really making the most of your dashboard insights?
Understanding what your metrics are telling you, how to connect them, and what actions you can take makes all the difference between average performance and long-term revenue growth. In this guide, we’ll walk you through how to read your PubPower report and understand the key metrics that help improve your ad performance.
Contents
- 1 How to Access to PubPower Report Overview
- 2 What Changes in Individual Metrics Indicate
- 3 Combining Metrics for Deeper Insights
- 3.1 1. High Impressions + Low Revenue = Low eCPM Problem
- 3.2 2. High Revenue + Low Impressions = High eCPM Efficiency
- 3.3 3. High Fill Rate + Low Viewability = Inefficient Monetization
- 3.4 4. High Viewability + Low Revenue = Weak Demand or Floor Issues
- 3.5 5. High Revenue from a Few Pages = Content Concentration Risk
- 3.6 6. Rising eCPM + Falling Revenue = Traffic Drop
- 3.7 7. High Ad Requests + Low Impressions
- 3.8 9. High Impressions + Low Viewability
- 3.9 10. High Fill Rate + Low Revenue
- 3.10 11. High Mobile Traffic + Low Mobile CPM
- 3.11 12. High eCPM + Low Viewability
- 4 What Publishers Can Do to Improve Ad Performance & Revenue
- 5 Conclusion: Turn Insights Into Action
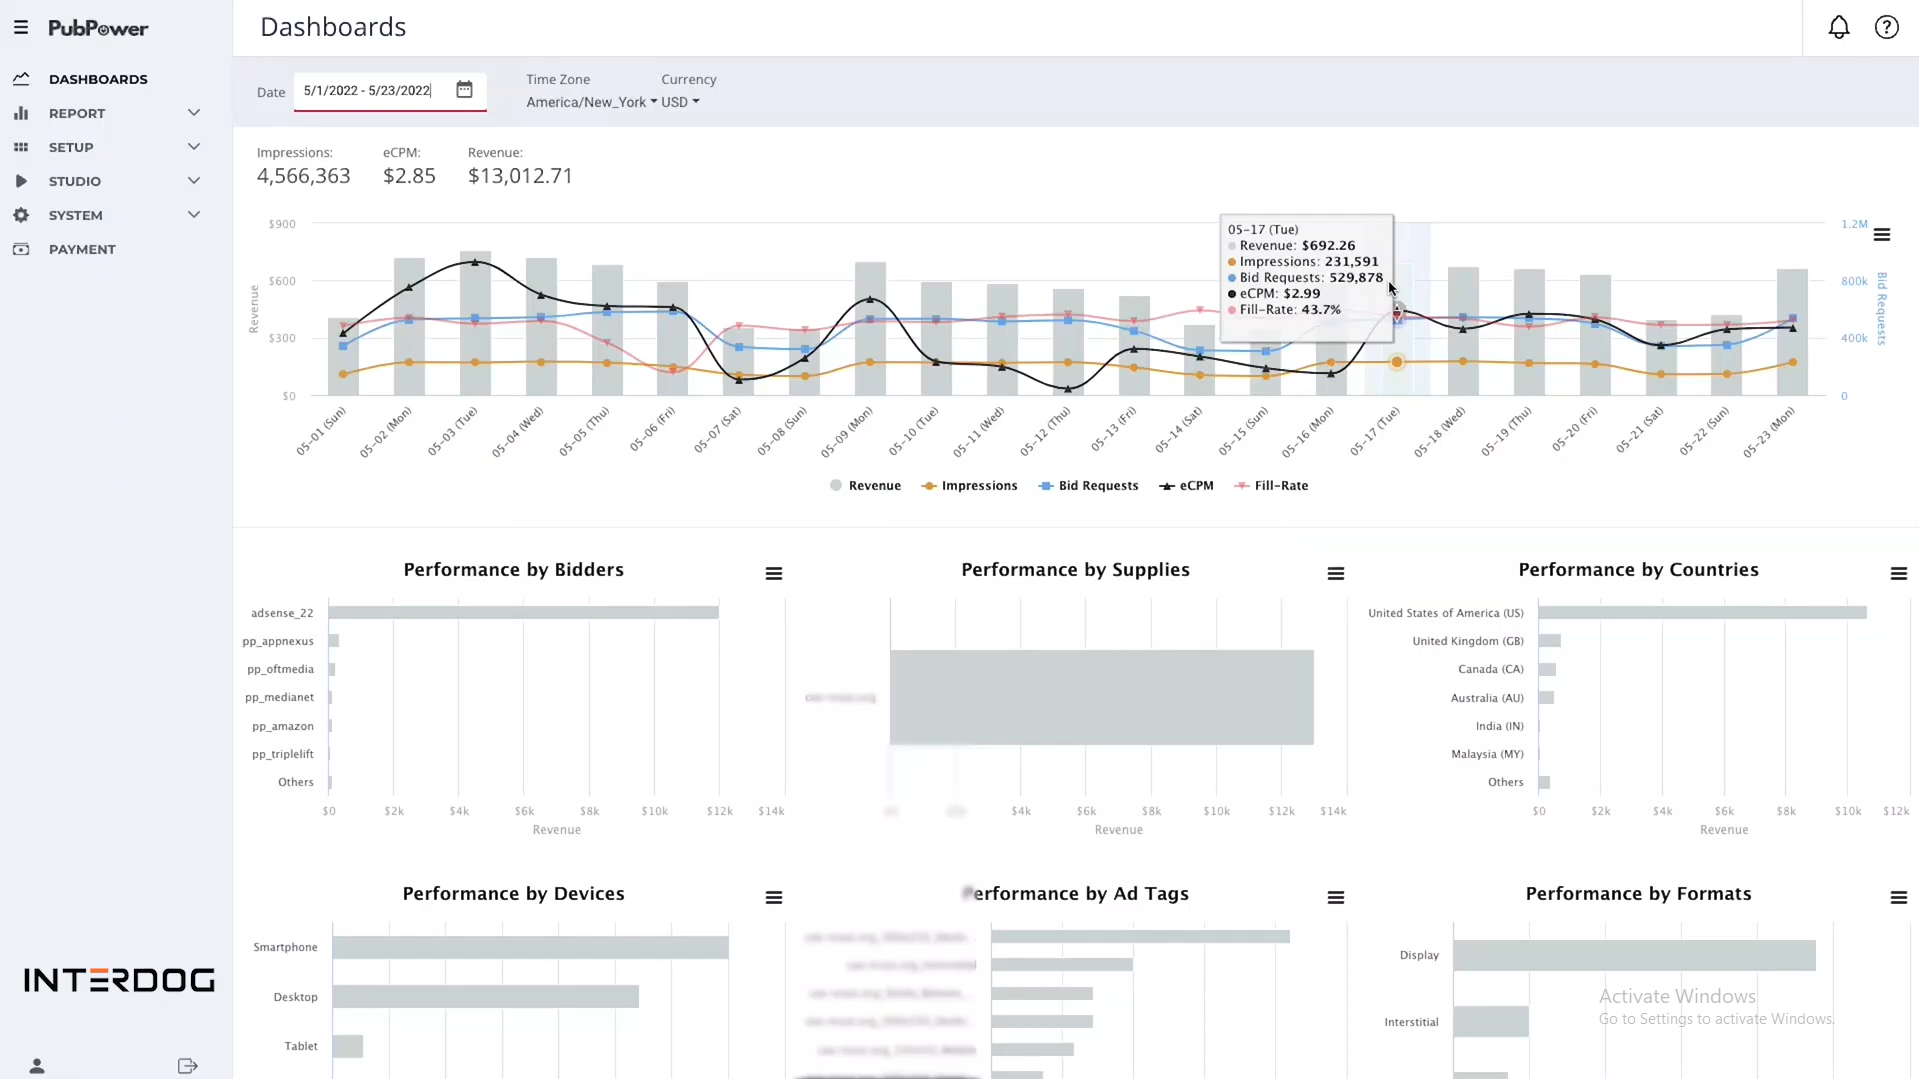
How to Access to PubPower Report Overview
- Log into PubPower Dashboard, here you can see an overview of your ad performance.
2. To access more detailed insights, go to the REPORT menu. You’ll find six types of reports to explore your data. However, in this blog, we’ll explore the ‘Overview’ to check all key metrics.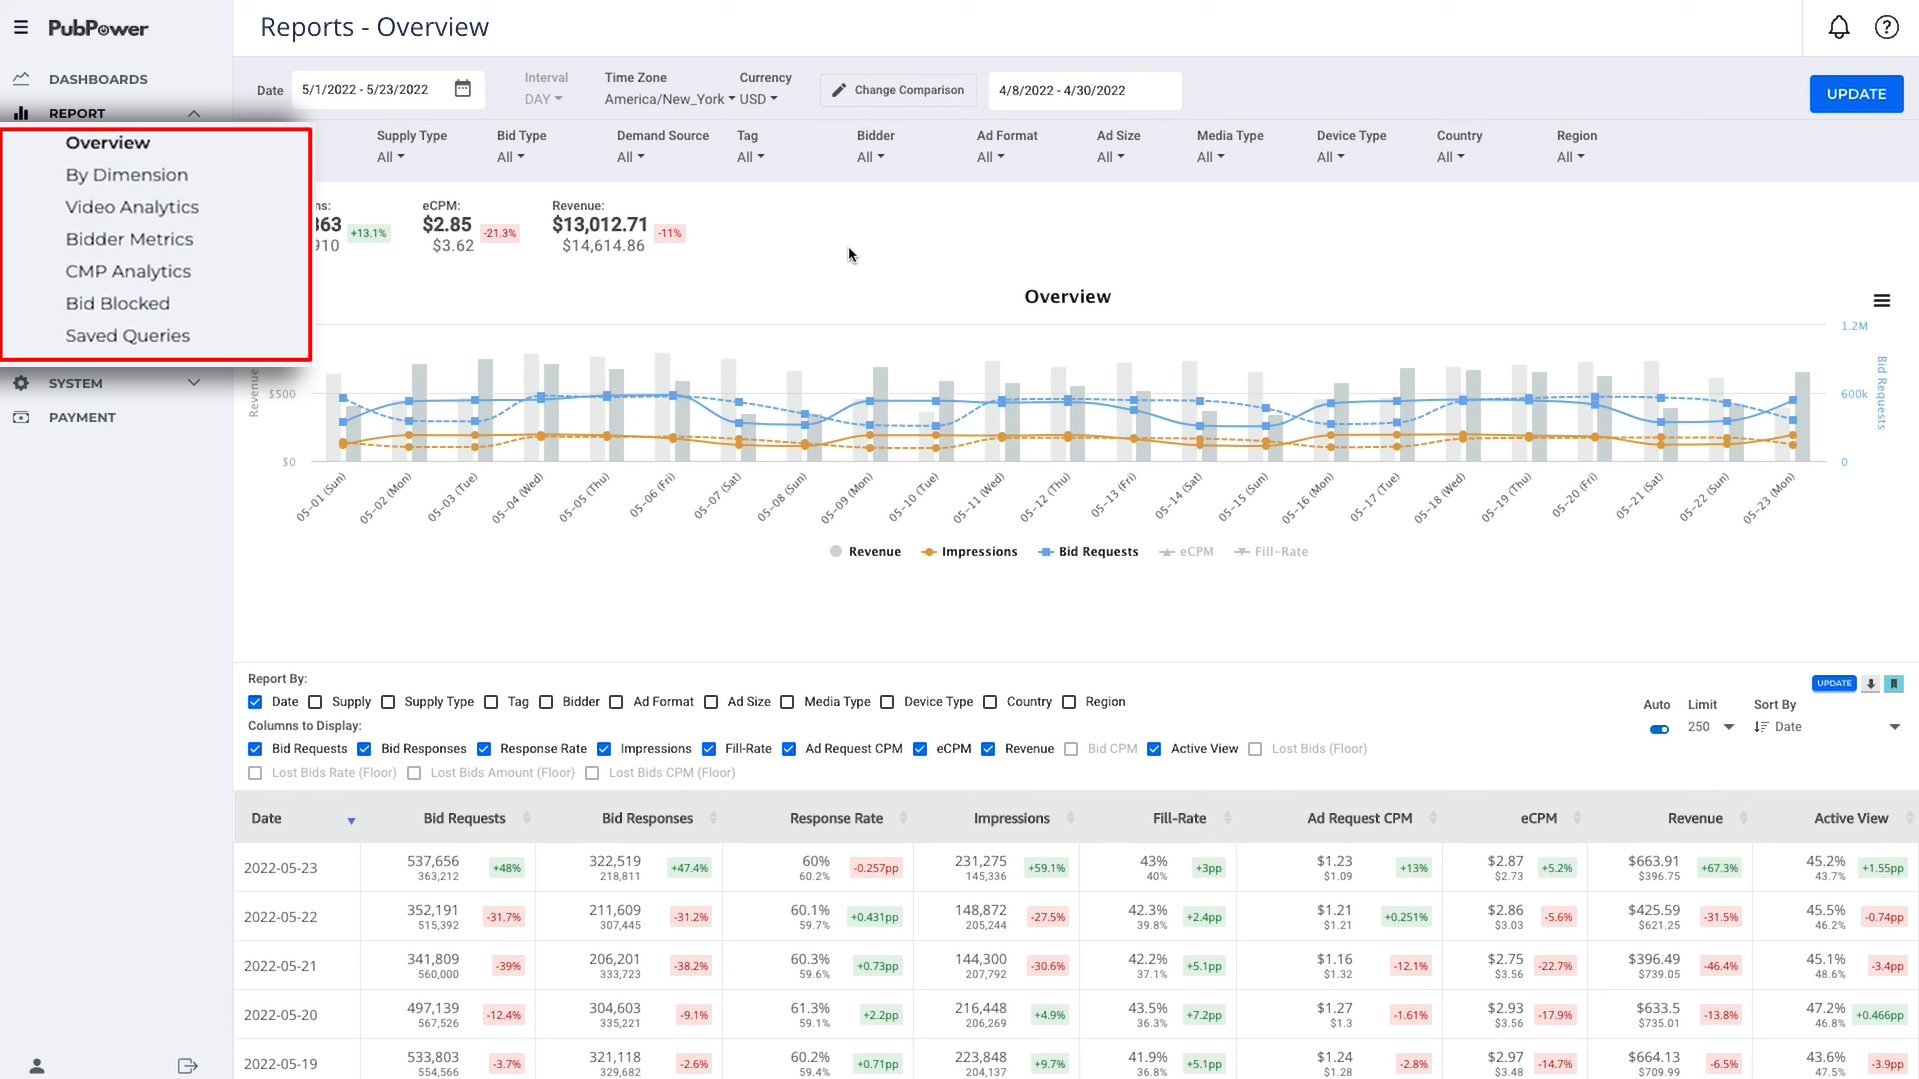
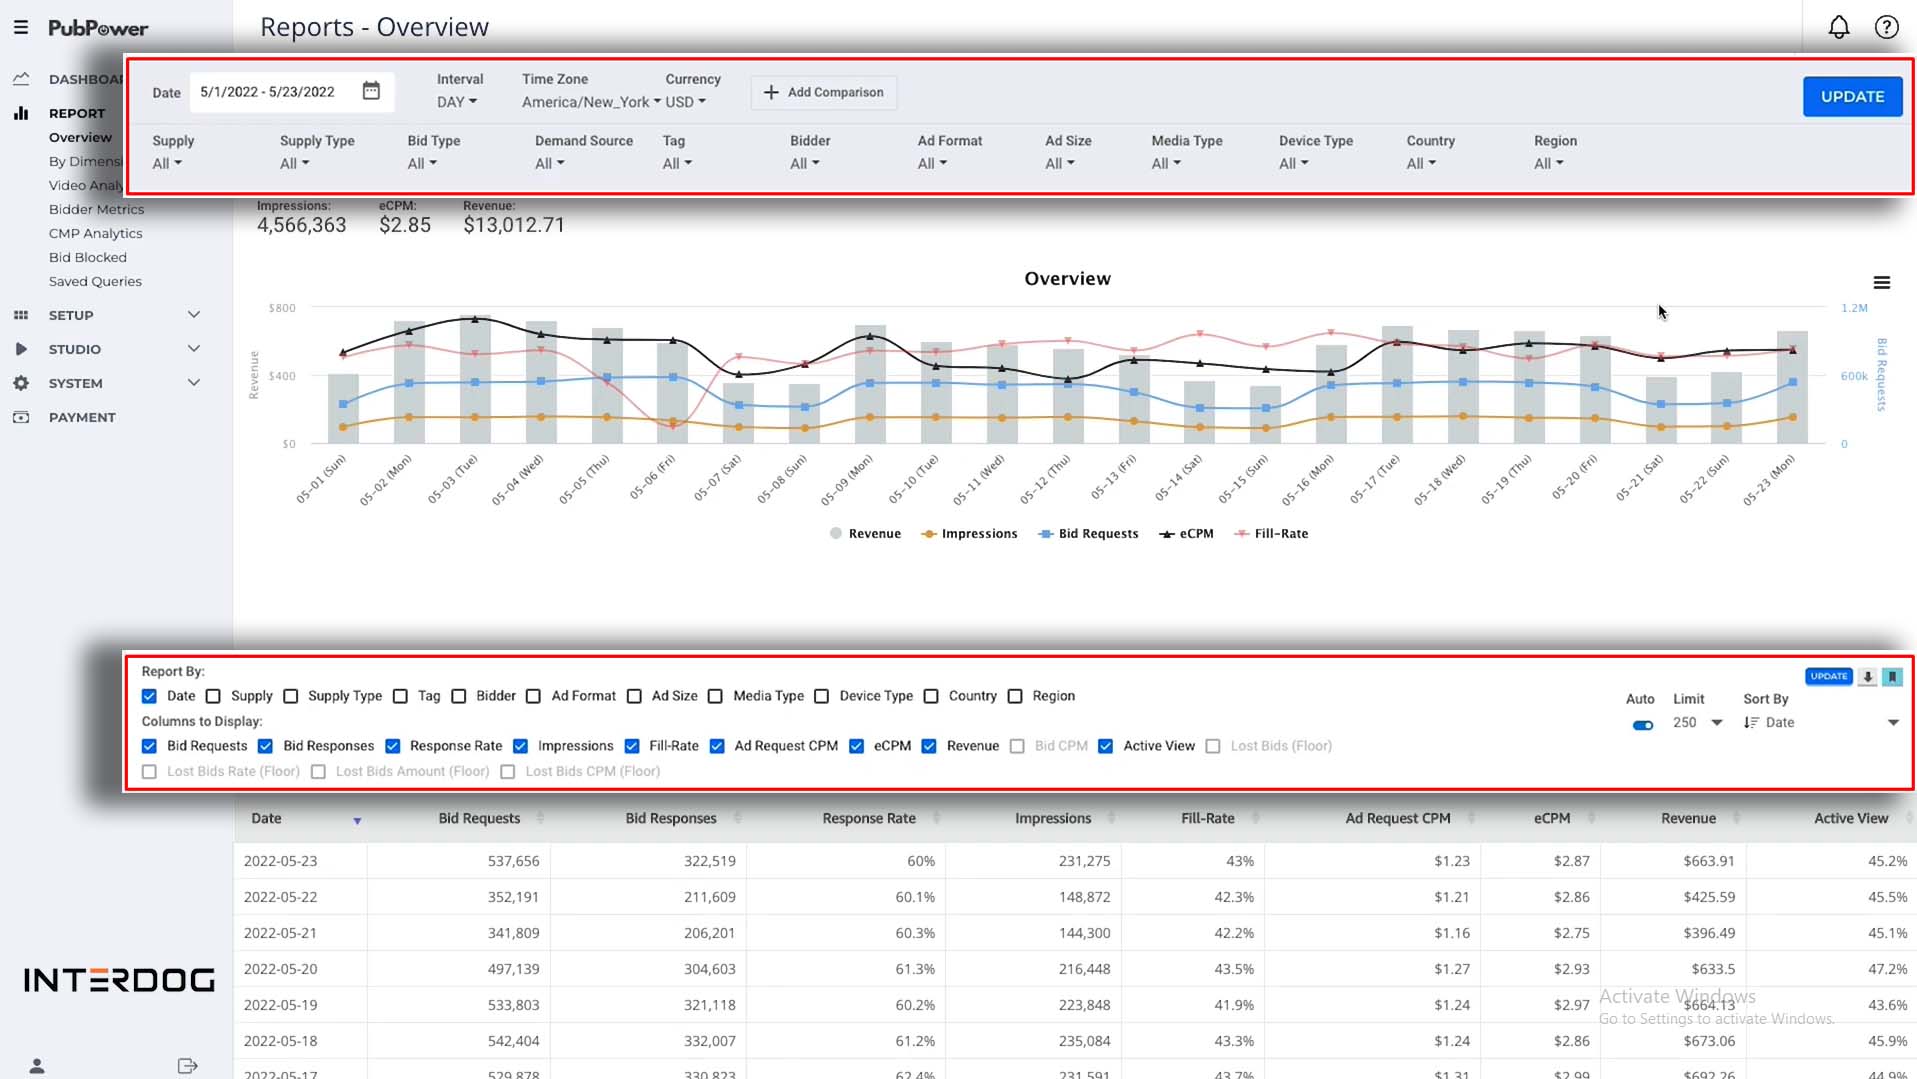
3. If you want to see specific metrics on the chart or table, you can use the filter by check all the necessary boxes, and click Update.
PubPower Overview also allows you to compare statistics between two periods of time. This is very important for publishers to measure and evaluate ad performance.
Now that you’ve learned how to use the PubPower report, let’s dive into what changes in key metrics actually mean—based on insights from our expert team
What Changes in Individual Metrics Indicate
Each core PubPower metric offers a piece of the monetization puzzle. Here’s how to read the signals:
1. Ad Requests
Represents: The number of times your site requested an ad from the server.
- Increase: Indicates growing traffic or more ad slots per page.
- Decrease: Could mean fewer users, fewer ad placements, or broken tags.
Fix: Check your header code, traffic source health, and ad unit loading.
2. Ad Impressions
Represents: The actual number of ads displayed to users.
- Increase:
– Likely due to higher traffic, more pages with ad placements, or successful SEO/social campaigns.
– May also indicate successful implementation of ad refresh or sticky units. - Decrease:
– Could signal a drop in traffic, fewer ads loading, or technical issues (e.g., ad tags not firing).
– Check if any pages were removed or ad placements changed
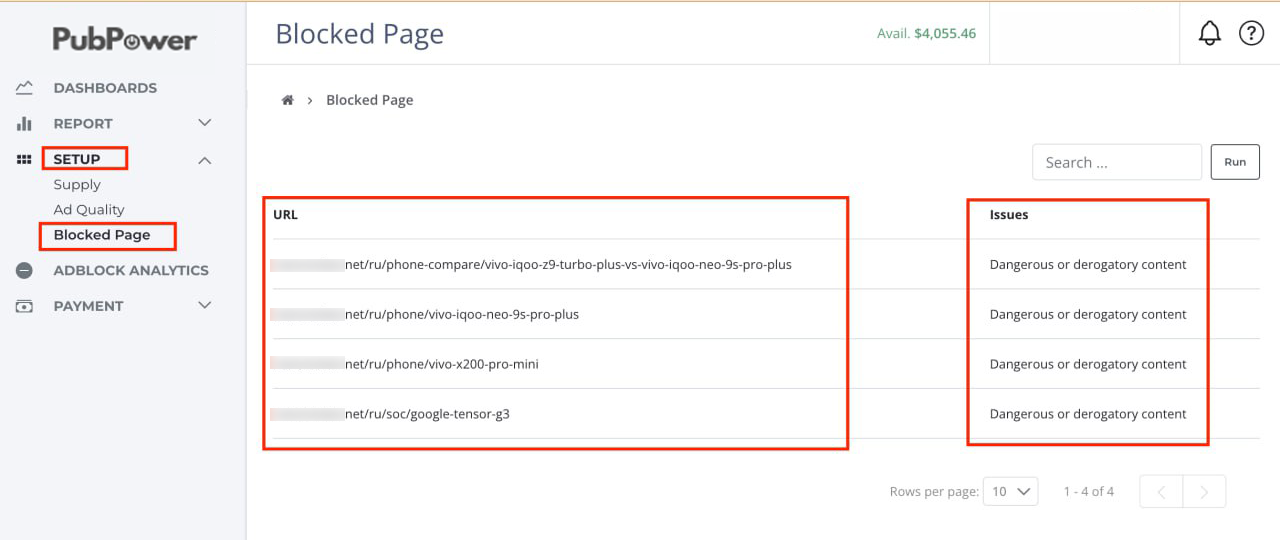
Fix: Review ad visibility, refresh settings, and PubPower’s Blocked Page report.
3. Revenue
Represents: Your actual earnings in a given period.
- Increase:
– Often a result of higher traffic, better-performing ad units, or stronger demand (e.g., during Q4).
– Could also mean better fill rates or higher CPMs due to advertiser competition. - Decrease:
– May come from a traffic drop, lower eCPMs, ad blocking, or policy violations.
– Check for recently blocked pages, demand shifts, or layout changes.
Fix: Dive into bidder performance, traffic sources, and recent layout or content changes.
4. eCPM (Effective Cost Per 1,000 Impressions)
Represents: The average earnings per 1,000 ad impressions.
- Increase:
– Indicates stronger advertiser bids or higher-quality traffic.
– Often seen in high-demand seasons (e.g., Black Friday, holidays) or after UX improvements. - Decrease:
– Could mean a dip in advertiser demand, poor viewability, invalid traffic, or low user engagement.
– May also be affected by low-performing placements or irrelevant traffic sources.
Fix: Improve ad layout, add high-yield content, or optimize geo targeting.
5. Fill Rate
Represents: The percentage of ad requests that resulted in an ad being served.
- Increase:
– Suggests better demand coverage or improvements in ad loading speed and configuration.
– Could result from adding new SSPs or improving latency. - Decrease:
– Often indicates demand gaps for certain geos or devices.
– May also point to technical issues (e.g., ad units not being called properly) or policy blocks.
Fix: Adjust floor prices, add bidders, or audit site loading speed.
6. Viewability Rate
Represents: The percent of ads that were actually seen (50% in view for at least 1 second).
- Increase:
– Reflects better ad placement (e.g., above the fold, sticky) or longer session duration.
– Higher viewability attracts premium demand and can increase CPMs. - Decrease:
– Could be due to poor placement (e.g., ads below the fold), fast scrolling, or content layout changes.
– Check if recent design updates affected ad visibility.
Fix: Reposition low-performing units, implement lazy loading with viewability triggers.
7. Device or Geo Performance
Represents: Revenue, CPM, and viewability by country or device.
- Increase in Tier 1 Geo/Device CPMs: Sign of high advertiser demand.
- Drop on mobile or tablet: Likely due to layout or loading issues.
Fix: Test mobile layouts and ensure demand is well integrated across device types.
Combining Metrics for Deeper Insights
Sometimes, a single metric doesn’t give you a whole picture of what needs to be changed and improved. Therefore, you need to look for multiple metrics at once to help you understand not just what’s happening—but why. Here are some examples of most valuable combinations to track:
1. High Impressions + Low Revenue = Low eCPM Problem
What it means:
You’re getting traffic, but advertisers aren’t bidding high. Could be poor viewability, low-quality traffic, or weak demand for your audience segment.
What to check:
- Ad placements (are they visible?)
- Traffic sources (is the traffic bot-generated or untargeted?)
- Content categories (is it low-value inventory?)
2. High Revenue + Low Impressions = High eCPM Efficiency
What it means:
You may have less traffic, but your content and placements are performing very well with advertisers.
What to do:
- Scale content that performs well
- Replicate ad layouts across other pages
- Consider premium placements (e.g., more native or sticky units)
3. High Fill Rate + Low Viewability = Inefficient Monetization
What it means:
Ads are loading, but not being seen. You’re monetizing impressions that advertisers may later devalue.
What to fix:
- Move ads above the fold
- Use lazy loading with viewability triggers
- Eliminate hidden or fast-scrolling placements
4. High Viewability + Low Revenue = Weak Demand or Floor Issues
What it means:
You’re offering premium real estate, but not getting paid accordingly. This may be due to:
- Too many bidders timing out
- Floor prices being too high or too low
- Lack of demand in certain geos or devices
What to try:
- Recalibrate floor pricing
- Check timeouts in header bidding
- Add additional demand partners or PMPs
5. High Revenue from a Few Pages = Content Concentration Risk
What it means:
Most of your income comes from a few URLs or categories. If those drop in traffic or rankings, your revenue could plummet.
What to do:
- Spread successful ad layouts to other pages
- Diversify content and traffic strategies
- Monitor top URLs in your reporting dashboard regularly
6. Rising eCPM + Falling Revenue = Traffic Drop
What it means:
Your inventory is getting more valuable, but you’re losing visitors—perhaps due to SEO drops, site performance issues, or seasonality.
Action steps:
- Check GA4 or traffic analytics
- Optimize for speed and UX
- Ramp up traffic acquisition campaigns
7. High Ad Requests + Low Impressions
What it means:
Your site is asking for ads, but they’re not being delivered. This often points to issues like timeouts, poor fill, or broken ad tags.
Action Steps:
- Audit ad tags for errors or misplacement
- Check bidder timeout settings and network latency
- Ensure demand partners are active and properly integrated
- Review fill rate for affected ad units or devices
- High Viewability + Low eCPM
What it means:
You’re offering premium ad real estate, but advertisers aren’t bidding high. This often means poor geo targeting, weak content categories, or limited bidder competition.
Action Steps:
- Promote content in Tier 1 geos
- Add new demand partners or PMP deals
- Revisit floor pricing—are they too low or too high?
- Use contextual ad formats (native, in-article) for relevance
9. High Impressions + Low Viewability
What it means:
Ads are being served, but not seen. Likely caused by placements below the fold, fast scrolling, or stacked units that users skip.
Action Steps:
- Reposition ad units higher on the page
- Replace low-performing banners with sticky formats
- Add lazy loading with viewability triggers
- Review scroll behavior in heatmaps (e.g. Microsoft Clarity)
10. High Fill Rate + Low Revenue
What it means:
You’re filling almost all ad requests, but at low CPMs. This suggests that your inventory is being sold cheaply—possibly to low-quality or default demand.
Action Steps:
- Raise floor prices strategically (test 5–10% increments)
- Block low-paying bidders or segments
- Introduce private deals or direct sales
- Analyze revenue by bidder to identify weak performers
11. High Mobile Traffic + Low Mobile CPM
What it means:
Your mobile users are active, but not well monetized—possibly due to poor layout, slow load times, or missing demand optimization.
Action Steps:
- Implement anchor ads and mobile-optimized units
- Improve mobile site speed and Core Web Vitals
- Audit ad tag performance on mobile browsers
- Enable ad refresh for long-form mobile content
12. High eCPM + Low Viewability
What it means:
You have premium demand, but your layout doesn’t let the ads be seen long enough. You may be wasting high-value impressions.
Action Steps:
- Prioritize sticky units and in-viewport ads
- Optimize content flow to keep users scrolling
- Avoid overlapping or auto-close formats that users skip
- Limit the use of lower placements in short-form content
What Publishers Can Do to Improve Ad Performance & Revenue
Once you understand what your data is telling you, here are the most effective things you can do:
1. Reposition Ads for Better Viewability
Ads above the fold or inside the content block tend to have higher viewability and earn more. Test sticky banners and in-article formats.

2. Enable Smart Ad Refresh
Use auto-refresh on pages with long dwell time, but only refresh when ads are viewable. Stick to 30–60 second intervals to comply with Google and PubPower guidelines.
3. Add More High-Value Content
Articles, tools, videos or quizzes that encourage long user sessions lead to more impressions per visit. More time = more monetization opportunities.

4. Target Premium Traffic Geographies
Prioritize audiences from Tier 1 regions like the US, UK, and CA. Translate or localize top-performing content to attract international demand.
5. Fix Policy & Blocked Page Issues
Use PubPower’s Blocked Page tool to detect and fix violations before they impact revenue. Address content flags, ad layout issues, or invalid traffic warnings promptly.
6. Audit Demand Partner Performance
Use “Revenue by Bidders” to see who pays best. If one partner dominates, diversify. If one underperforms, investigate or replace.
7. Read Reports Weekly & Adjust
Track trends in viewability, eCPM, fill rate, and revenue. Small weekly optimizations compound into major revenue gains over time.
8. Consult a PubPower Expert for Tailored Insights
Sometimes, data can only tell you so much on its own. PubPower experts can help you interpret nuanced patterns, spot missed opportunities, and apply strategies that are proven to work across other successful publishers.
Conclusion: Turn Insights Into Action
Understanding your PubPower report is more than just reading numbers—it’s about interpreting trends, identifying patterns, and making smart, data-backed decisions to improve your ad performance. By knowing what changes in metrics indicate and combining them for deeper insights, you’re already on your way to maximizing revenue and optimizing your site.
But this is just the beginning.
In the next blog, we’ll take it a step further by exploring the Dimension Report—a powerful tool that breaks down your performance by device, geography, ad unit, and more. It’s where you’ll uncover which pages, placements, and platforms are truly driving your earnings.
