
In Part 1 of our PubPower Report Guide, we introduced the Overview Report. That report helps publishers track high-level performance indicators such as revenue, impressions, eCPM, and fill rate.
In this article, we will explain how to use the Dimension Report. This tool allows you to analyze your ad performance across various categories such as devices, ad formats, bidders, and supply types. By understanding how each dimension contributes to your earnings, you can make more informed decisions and uncover hidden revenue opportunities.
Contents
What Is the Dimension Report?
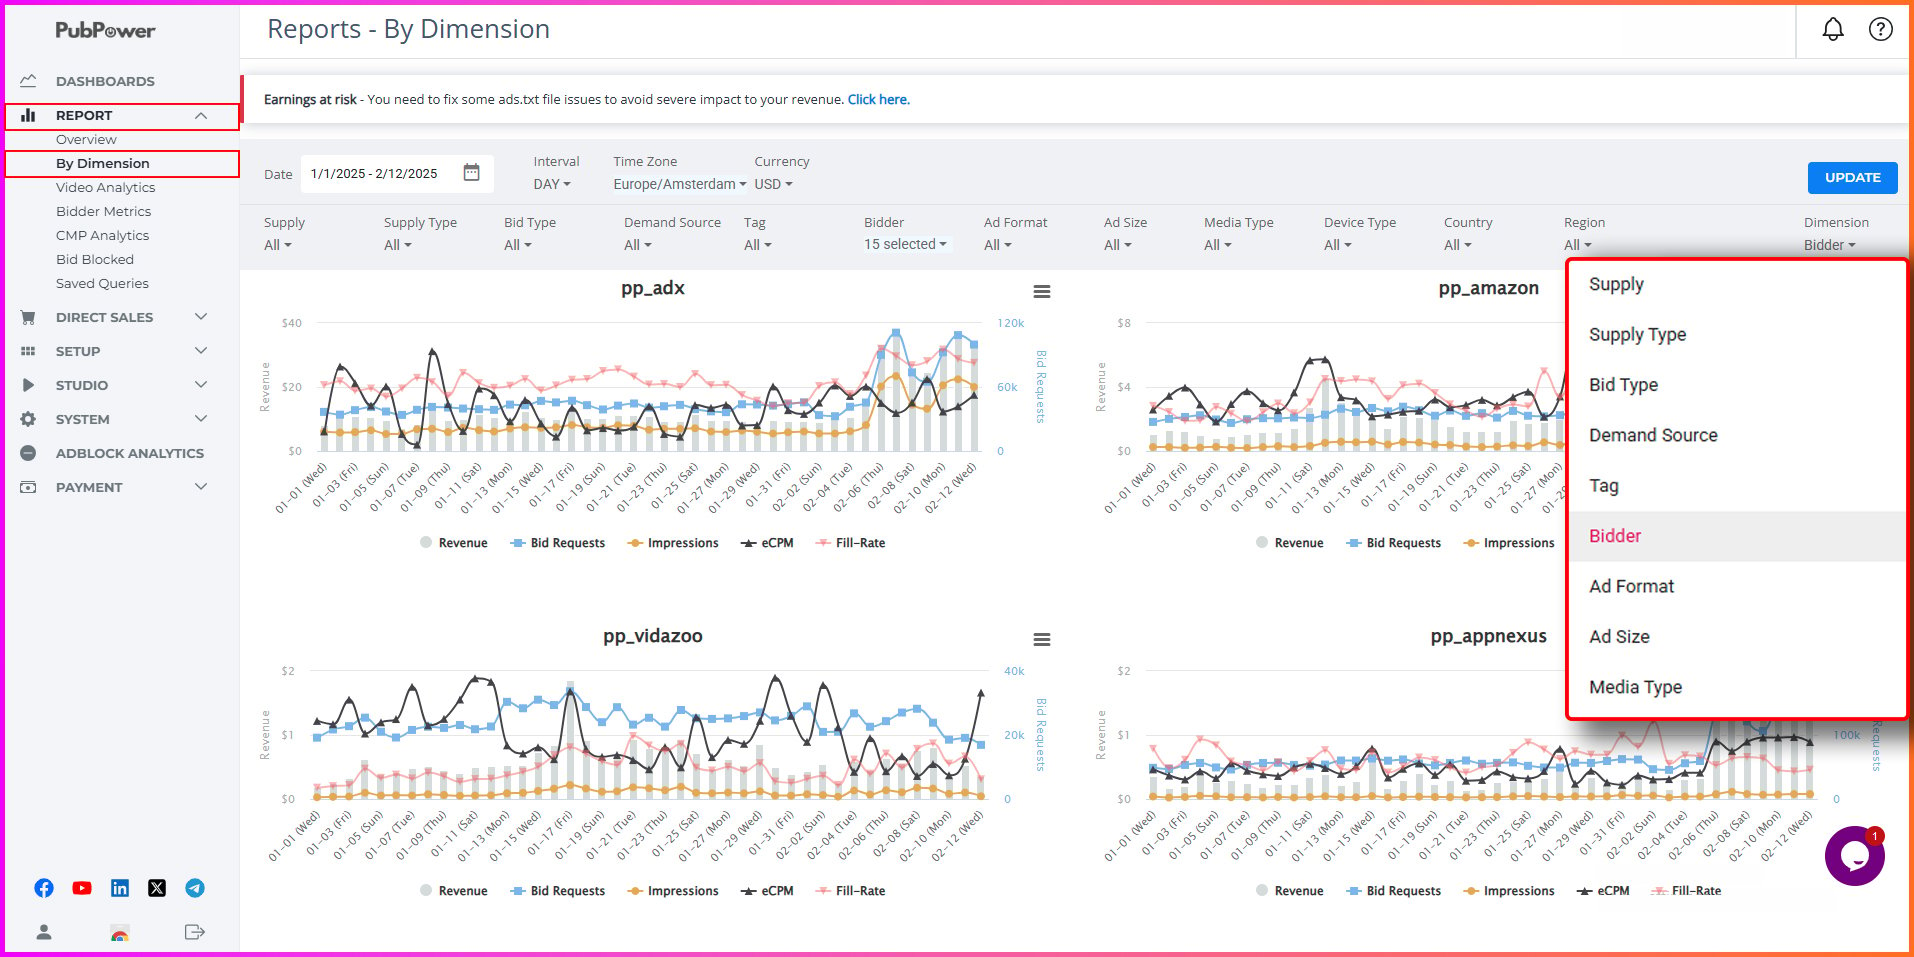
The Dimension Report is a powerful analytics feature within the PubPower dashboard. It enables publishers to break down their ad performance by specific characteristics—called dimensions—such as device type, ad unit, country, or demand source.
This report allows you to move beyond general trends and analyze the where, how, and why of your ad revenue. For example, you can determine whether mobile traffic from the United States generates higher eCPMs than desktop traffic from Southeast Asia. You can also compare ad formats to identify which ones deliver the best balance between revenue and user experience.
Why the Dimension Report Matters
The Dimension Report matters because it gives you granular control over your monetization strategy. Instead of making changes based on general trends, you can take data-backed actions based on specific segments of your audience or inventory.
For instance, if you discover that a particular ad unit on mobile performs poorly, you can test a different layout or format just for that segment—without affecting the rest of your setup.
Additionally, the visual charts at the top of the Dimension Report allow you to quickly identify trends and compare performance across different data slices. The charts help you interpret complex data sets in a user-friendly format.
Dimensions Available in the PubPower Report
The Dimension Report includes several categories that allow you to dissect your revenue performance. Below is a breakdown of each available dimension and its purpose:
By Supply Type (Web vs. App)
Understand performance based on traffic environment.
→ Why it matters: App and web behavior differ significantly. This view supports platform-specific optimizations.
By Supply (Domain/App Name)
Breaks down performance by specific websites or apps under your PubPower account.
→ Why it matters: If you operate multiple properties, this helps you compare their efficiency and ROI side by side.
By Country (Geo)
Shows how different regions contribute to impressions, revenue, and eCPM.
→ Why it matters: Tier 1 countries like the US, UK, and Canada usually offer higher CPMs. This helps you prioritize traffic and content efforts in top-paying markets.
By Device
Compare performance across desktop, mobile, and tablet.
→ Why it matters: User behavior and ad format performance vary greatly by device. For example, sticky rail ads thrive on desktop, while anchor ads dominate on mobile.
By Ad Unit
Analyzes performance by each placement you’ve defined (e.g., “Top Banner,” “Sidebar”).
→ Why it matters: Helps you optimize your layout by scaling high-performers and reworking weak placements.
By Ad Tag
Breaks down performance by the actual ad tag (code snippet) on the site or app.
→ Why it matters: Use this for more technical or granular comparisons—like different sizes or refresh settings under the same ad unit.
*Ad Unit vs Ad Tag:
- Ad Unit = placement location
- Ad Tag = execution code that serves ads in that location
Use both to evaluate layout and tag-level performance together.
By Ad Format
View results by ad types: display, native, video, or outstream.
→ Why it matters: Some formats drive stronger engagement or CPMs. This report helps you balance UX and revenue.
By Ad Size
See which banner sizes (e.g., 300×250, 728×90) are performing best.
→ Why it matters: Some sizes attract more premium demand depending on layout, visibility, and device compatibility.
By Media Type
Split data by creative type: banner vs. video.
→ Why it matters: Video ads typically yield higher CPMs. Knowing your media mix helps with layout and strategy planning.
By Bidder (Demand Source)
Shows which SSPs, exchanges, or platforms are contributing to revenue.
→ Why it matters: Use this to monitor demand health, remove low-value sources, and prioritize high-performing bidders.
By Time (Day, Week, Month)
Analyze trends across time frames.
→ Why it matters: Identify seasonal dips, daily spikes, or the impact of recent changes (e.g., new layouts or ad partners).
How to Use the Dimension Report Effectively
Optimize Your Layout
Use ad unit and ad tag data to evaluate the performance of each placement. Replace or reposition low-performing placements. Scale high-performing ones across similar pages or properties.
Tailor Device-Specific Strategy
If mobile generates most of your traffic but yields low revenue, test mobile-specific formats like anchor ads, and reduce layout clutter to improve viewability.
Prioritize High-Value Geos
Focus content creation and promotion in countries with higher CPMs. Localize or translate top-performing content to attract international traffic from valuable regions.
Adjust Demand Sources
Review the bidder report to identify SSPs with poor fill rates or low eCPMs. Work with your PubPower account manager to test additional bidders or explore private marketplace (PMP) deals.
Analyze Format & Size Performance
Use the ad format and ad size dimensions to discover which creatives perform best on your site. Run A/B tests to see how different combinations affect earnings.
Final Thoughts
The Dimension Report gives you a detailed lens into how different parts of your monetization setup are performing. With this information, you can make smarter, more targeted decisions to grow your revenue efficiently—without relying on guesswork.
By using the Dimension Report regularly, you will:
- Improve underperforming ad placements
- Increase earnings from top-performing segments
- Strengthen your demand stack
- Tailor UX to user behavior and device type
In the next part of this series, we will explore how to use Bidder and Ad Unit Reports to dig even deeper into your ad revenue strategy.
Need help with your Dimension Report? Contact your PubPower support team—we’re here to help you turn data into growth.
